

Trading with the Volume Profile
VPVR, VPSV and Fixed Range

Disclaimer: This is not financial advice and I am not a financial advisor. This article is for entertainment purpose only. Trade at your own risk.

I. Introduction
In Auction Market Theory (AMT), trade volume allows determining whether a market is efficient, i.e. trades within a narrow price range for a prolonged period of time at relatively high volume. Now, imagine a vendor selling multiple units of a commodity at 1$ a piece with a satisfying amounts of buyers for said commodity (i.e. significant buying volume):
The vendor then decides to raise the price to 1.25$, and while there are still buyers, the trade volume decreased moderately. A 1.5$, the decrease in volume accelerates;
Still satisfied, the seller raises the price to 1.75$. This time, only one buyer purchases the commodity;
Finally, the price is set to 2$: no buyers step in at that amount;
We can conclude that the auction finished at 1.75$ and that this specific market is now illiquid, through the absence of volume. The seller will have to lower the price to get back to a more efficient setting.
You can imagine the opposite situation: the vendor starts selling at 0.75$ attracting an even higher buying volume than at 1.5$, and potentially depleting inventory too fast (too much demand, limited supply). To avoid shortage, the price must be raised to a level where trade is facilitated efficiently (decent volume, prolonged period of time at a price satisfying both buyers & sellers).
Financial markets work in a similar fashion with very high volume at the bottom when an asset is undervalued, and decreasing volume at the top when it is overvalued.
To represent the above graphically, we can think of a normal distribution with the X axis as price and the Y axis as volume.

Figure 1. Representation of a normal distribution
Referring to our simplified example above, 68.27% of the volume would be traded between $0.75-1.25$ considered as the Value Area, i.e. the fair value range of the traded asset. As you add units of standard deviation, the volume consequently decreases, with a finished auction priced at 1.75$.
By plotting this on a candlestick chart and rotating it by 90º, we can obtain a Volume Profile. Obviously, volume is never perfectly distributed like a normal distribution so you will obtain different profile shapes depending on the price action.
One of the first indicator people hears about when they start trading is volume, but plotted on the time (X) axis, while volume profile is plotted on the price level (Y) axis.

Figure 2. Volume Profile plotted on BTC/USD, with Value Area and Point of Control
While volume is a powerful indicator to identify the beginning & exhaustion of trends, the Volume Profile is equally important, if not more, to identify levels where the market is efficient and where it’s not.
II. Characteristics of the Volume Profile
There are several components of a Volume Profile:
Value Area (VA): range of price levels in which 68.2% of all volume is traded during a given time period (note: Trading View uses 70% as default setting);
Value Area Low (VAL) & Value Area High (VAH): important reference points that can act as support or resistance. They are the boundaries of the VA;
Point of Control (POC): The level at which the highest volume is traded, i.e. where the market is the most efficient;
Low Volume Node (LVN): an area with low executed trade volume;
High Volume Node (HVN): an area with high executed trade volume.
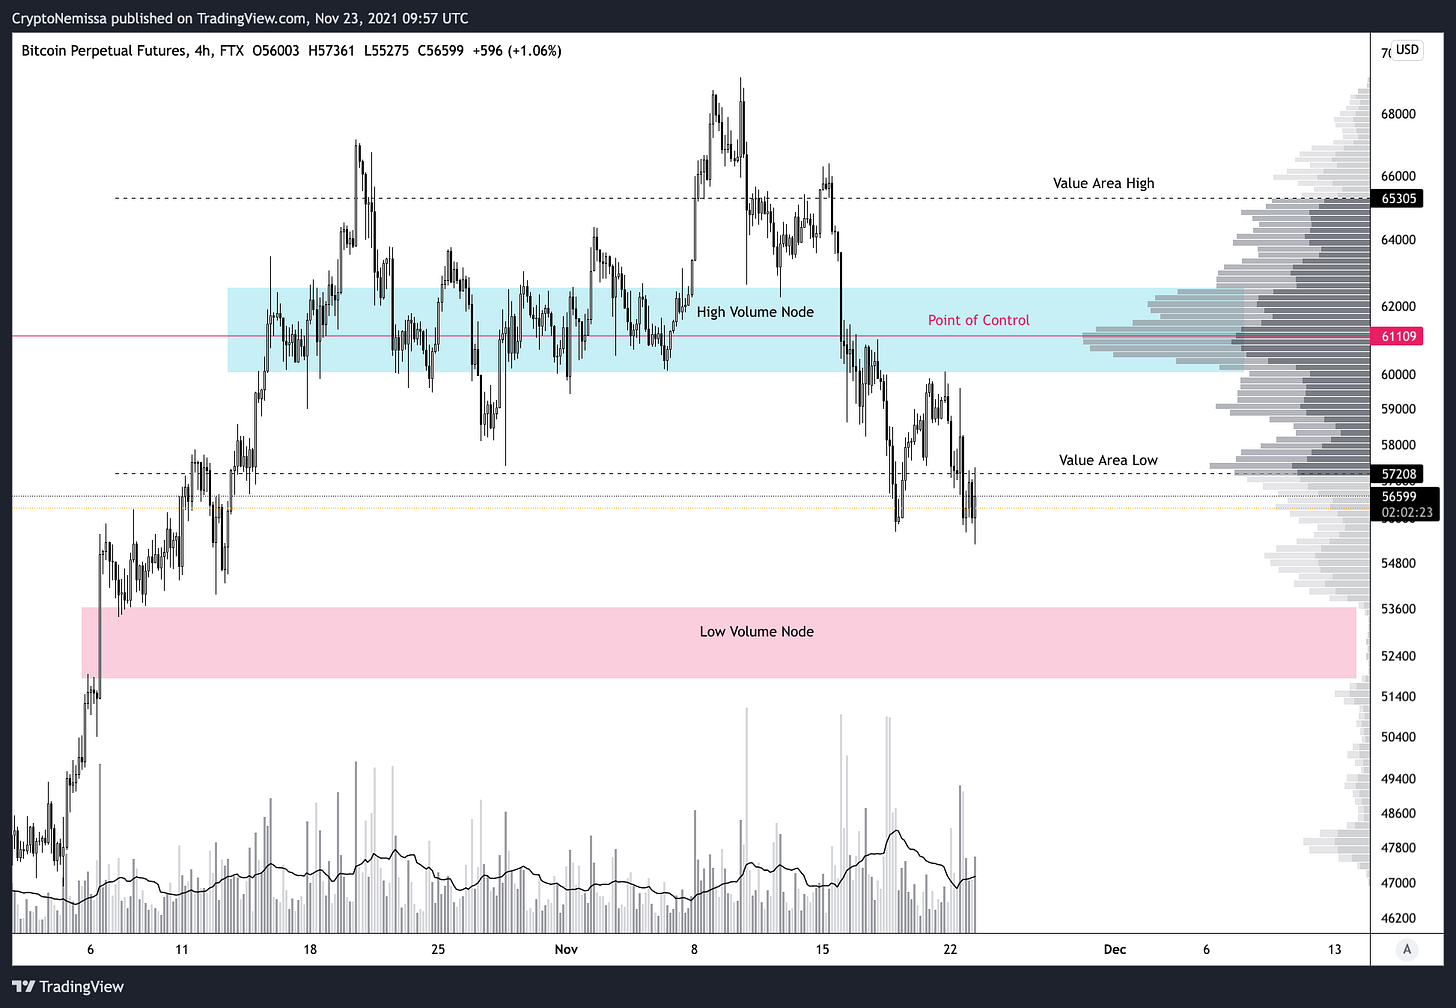

Figure 3. The Characteristics of the Volume Profile
On the above you can clearly see that the HVN is the zone where the market spent the most time, paired with a volume being a lot higher than in other areas. In opposition, the market spent very little time going through the LVN and we can observe a gap in volume in that specific zone.
III. Interpreting the Volume Profile
While the information above is interesting, we must be able to use in in order to develop a trading strategy.
The general rules are that:
Edges of both LVNs and HVNs reject prices, i.e. act as S/R levels;
HVNs accept prices, e.g. through a consolidation;
The market generally goes through LVNs very fast, e.g. through an impulsive move;
The POC or highest volume level of a HVN often acts as a pivot points if price is trading in a range: as this is the level with the thickest liquidity you can expect the market to rotate around it for a while.
In that order, from a R:R perspective it’s a lot better to use LVNs & HVNs edges for entries because they aren’t considered as fair value by market participants. In opposition, entering at POC or HVNs’ high volume levels will give you a “fair” price but the price action will become sluggish and can resolve in any direction.
Trading with indicators is context-dependant and this is also the case with the Volume Profile. In a bullish, trending environment, pullbacks are usually expected down to the VAH (support) and rallies in a bearish trend could potentially tap into VAL (resistance).
Therefore, an interesting strategy is to identify LVNs and see if there is some kind of price action reaction at the level, e.g. a sweep of the highs/lows.
All in all, you can think as volume node edges, VAL and VAH as potential resistance & support levels and HVNs as consolidation zones while LVNs are commonly impulsive areas. More often than not you can also identify confluence between reactions to the Volume Profile levels and VWAP retests, CVD exhaustion or absorption and trapped buyers/sellers visible on footprint charts, so that you can have a good guess whether the price you’re entering at is a key level.
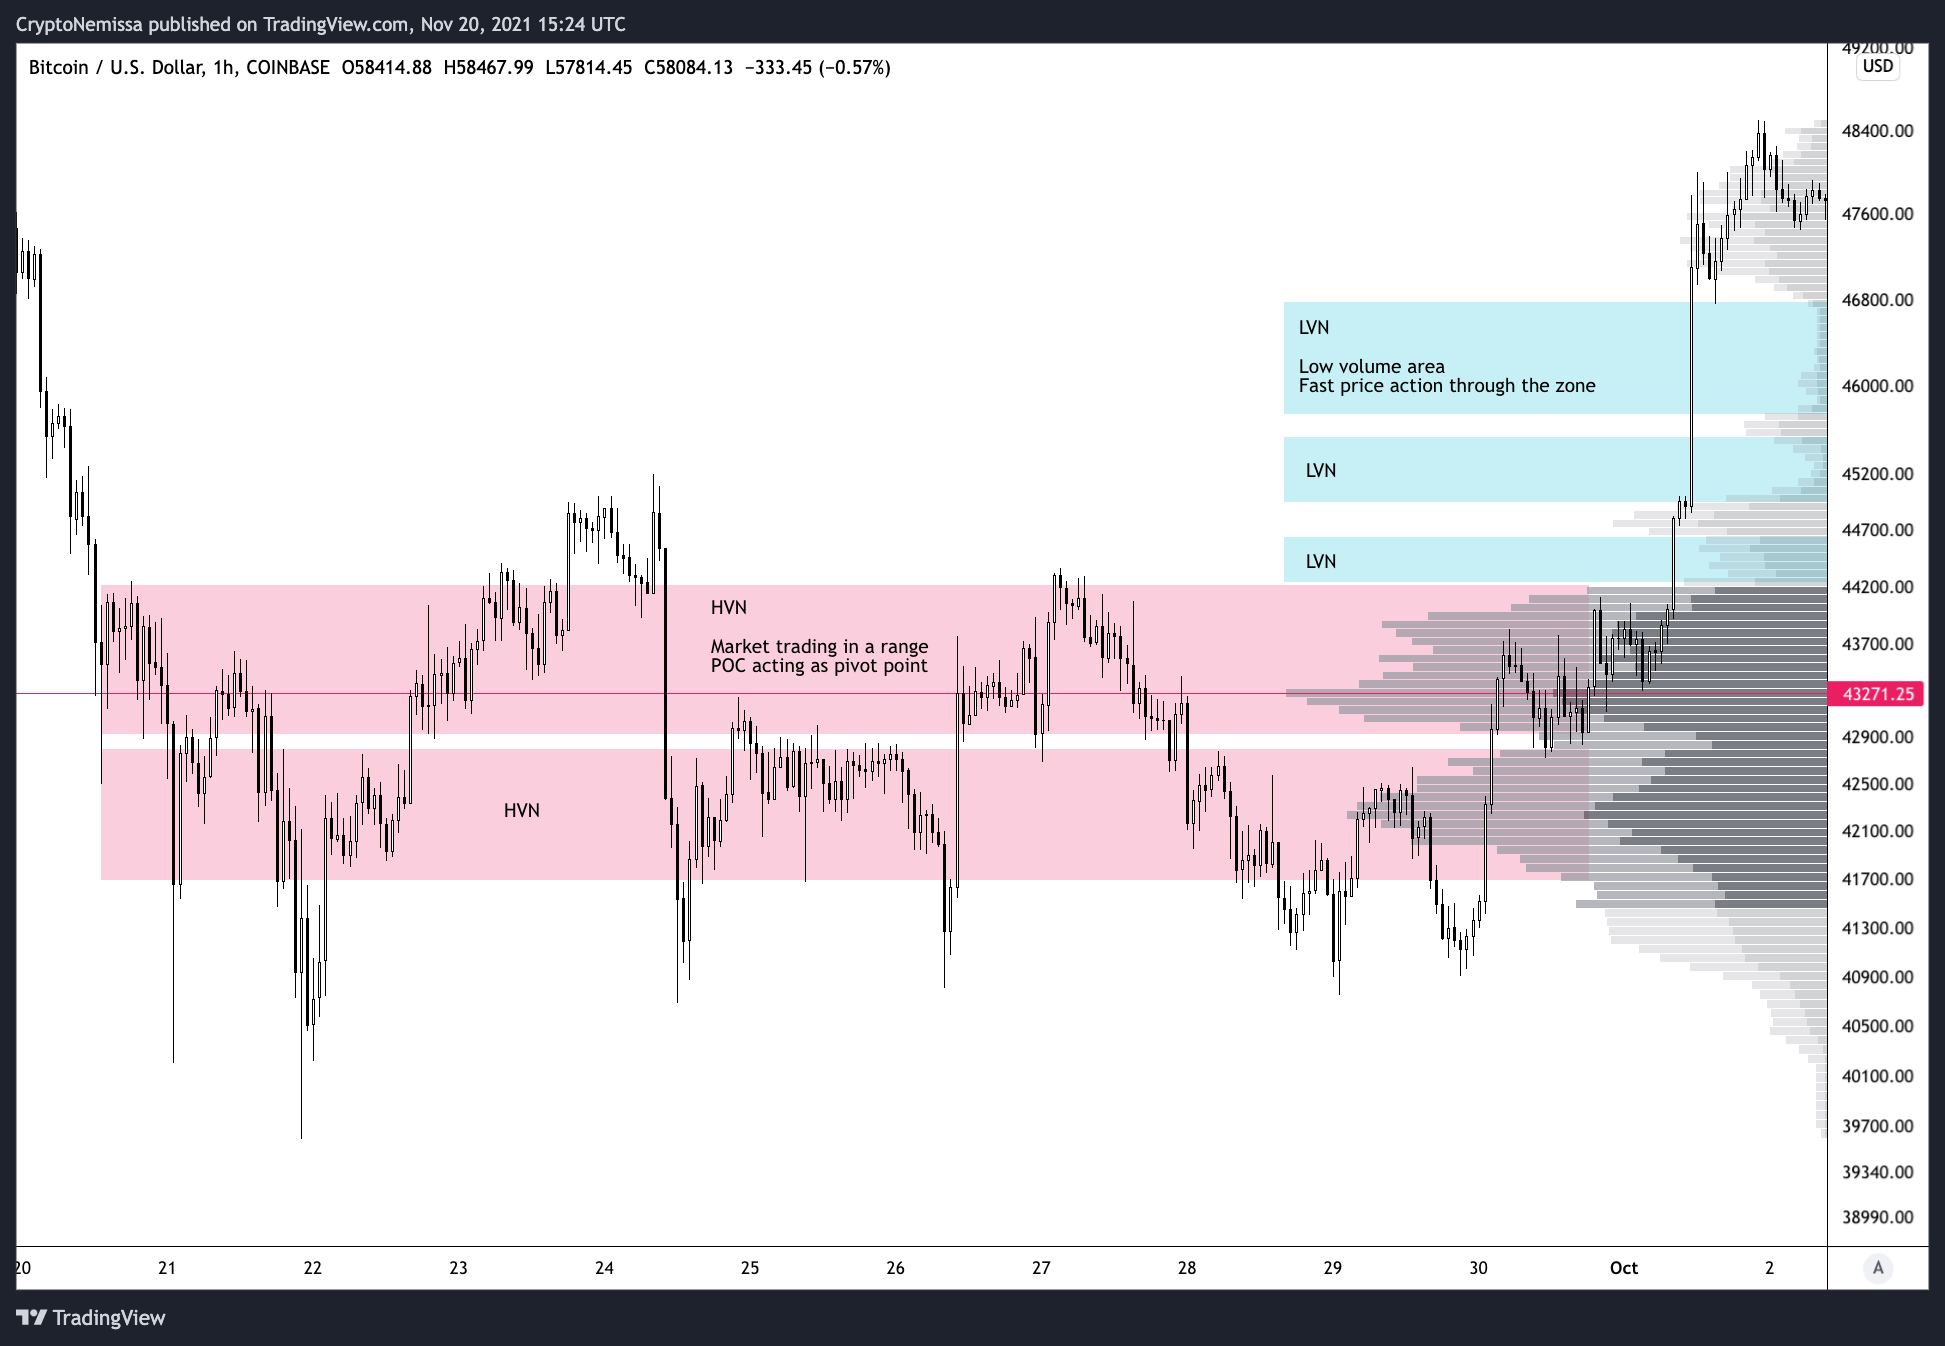
Figure 4. Volume Profile on BTC/USD with HVNs & LVNs highlighted
The above is a representation of the Volume Profile plotted on BTC/USD. You can clearly see the areas with high executed volume within a range and the ones with low executed volume outside of it. Because defining HVNs and LVNs can be quite subjective, you could definitely consolidate the 2 HVNs and 3 LVNs into bigger ones.
Price breaking out of value (break of VAH in this example) makes up for a great trade to take, as this is usually the start of a new trend, which is the meat of the bone when it comes to trading. That being said, when it comes to BTC there is typically very little time to react, so forget about entering on a re-test, especially when it’s early in the trend. Buying breakouts on high volume is always a better strategy after a long period of consolidation.
IV. Volume Profile Visible Range (VPVR)
The VPVR is one of the indicators you can use to display the Volume Profile on charting platforms such as Trading View. The “Visible Range” implies that the profile will be displayed based on the price action visible on the screen. Therefore, if you zoom in/out or move the chart on the X axis, it will be refreshed along with its VAH, VAL and POC. Consequently, it’s quite important to only look at relevant price action on your screen, e.g. if the market has been trading in a range for a while, make sure to focus on it instead of including the previous trending PA as well. It takes a bit of practise to master and this is why you should use it in confluence with other trading concepts (S/R levels) or indicators.
As for input settings, using “120” as “Row Size” allows a clearer definition of the profile and its levels. It’s fine to keep “70” as Value Area Volume, which is the default on Trading View. Developing POC and VA can lead to an overload of information on the chart, so disabling them is OK, as you’ll be able to see the POC and VA on the profile anyway.
V. Volume Profile Session Volume (VPSV)
The VPSV is an interesting tool because instead of having a profile refreshing depending on what you have on the screen, the VPSV will display the one for the current & past sessions. While the session period is typically 1 day, you can break it down to lower timeframes depending on the charting platform you use. In the case of Trading View, it’s fixed to 1 day.

Figure 5. Example of VPSV plotted on BTC. Each Volume Profile represents 1 day of price action
Similarly to the VPVR, the VPSV will also have VAL, VAH, HVNs, LVNs and POC for the session. In general VAL and VAH of the previous session will act as support or resistance. Therefore if the price trades higher than the previous day’s VAH (pdVAH) and a pullback is in motion, we can expect a reaction from pdVAH. Same thing if it’s trading below pdVAL we could enter a short position after a reaction from pdVAL, especially if the level is in confluence with other S/R levels, VWAP, EMAs or whatever you feel comfortable with.

Figure 6. Confluence between previous sessions’s VAH/VAL/POC and support levels
On the above chart, we have confluence between the previous day’s POC and a support level (top of a demand zone). We also have confluence between VAH 2 days ago, previous day’s VAL and another support level (bottom of a demand zone).
You should expect a reaction from these levels and while there is no foolproof way of finding out in advance which level will act as a reversal point, you can get clues from volume, indicators or order flow.
In that case, we currently have a bounce from the previous day’s POC. Untested POC are called naked POC (nPOC), and regularly offer some kind of reaction.
In traditional markets, nPOCs are good levels to take profit at on a position, rather than good entry levels. But for crypto trading, being a much more illiquid and volatile market, you should also consider them as both entries or profit taking opportunities.
If price fails to follow through on that bounce, we could expect a sweep of the $13.38 level with a close above (on the 30 mins or 1h TF). If so, entering a long position for continuation upwards presents a good R:R from there. A couple of ticks below the low of the wick would be a decent stop loss placement. While a good target would be a next nPOC.
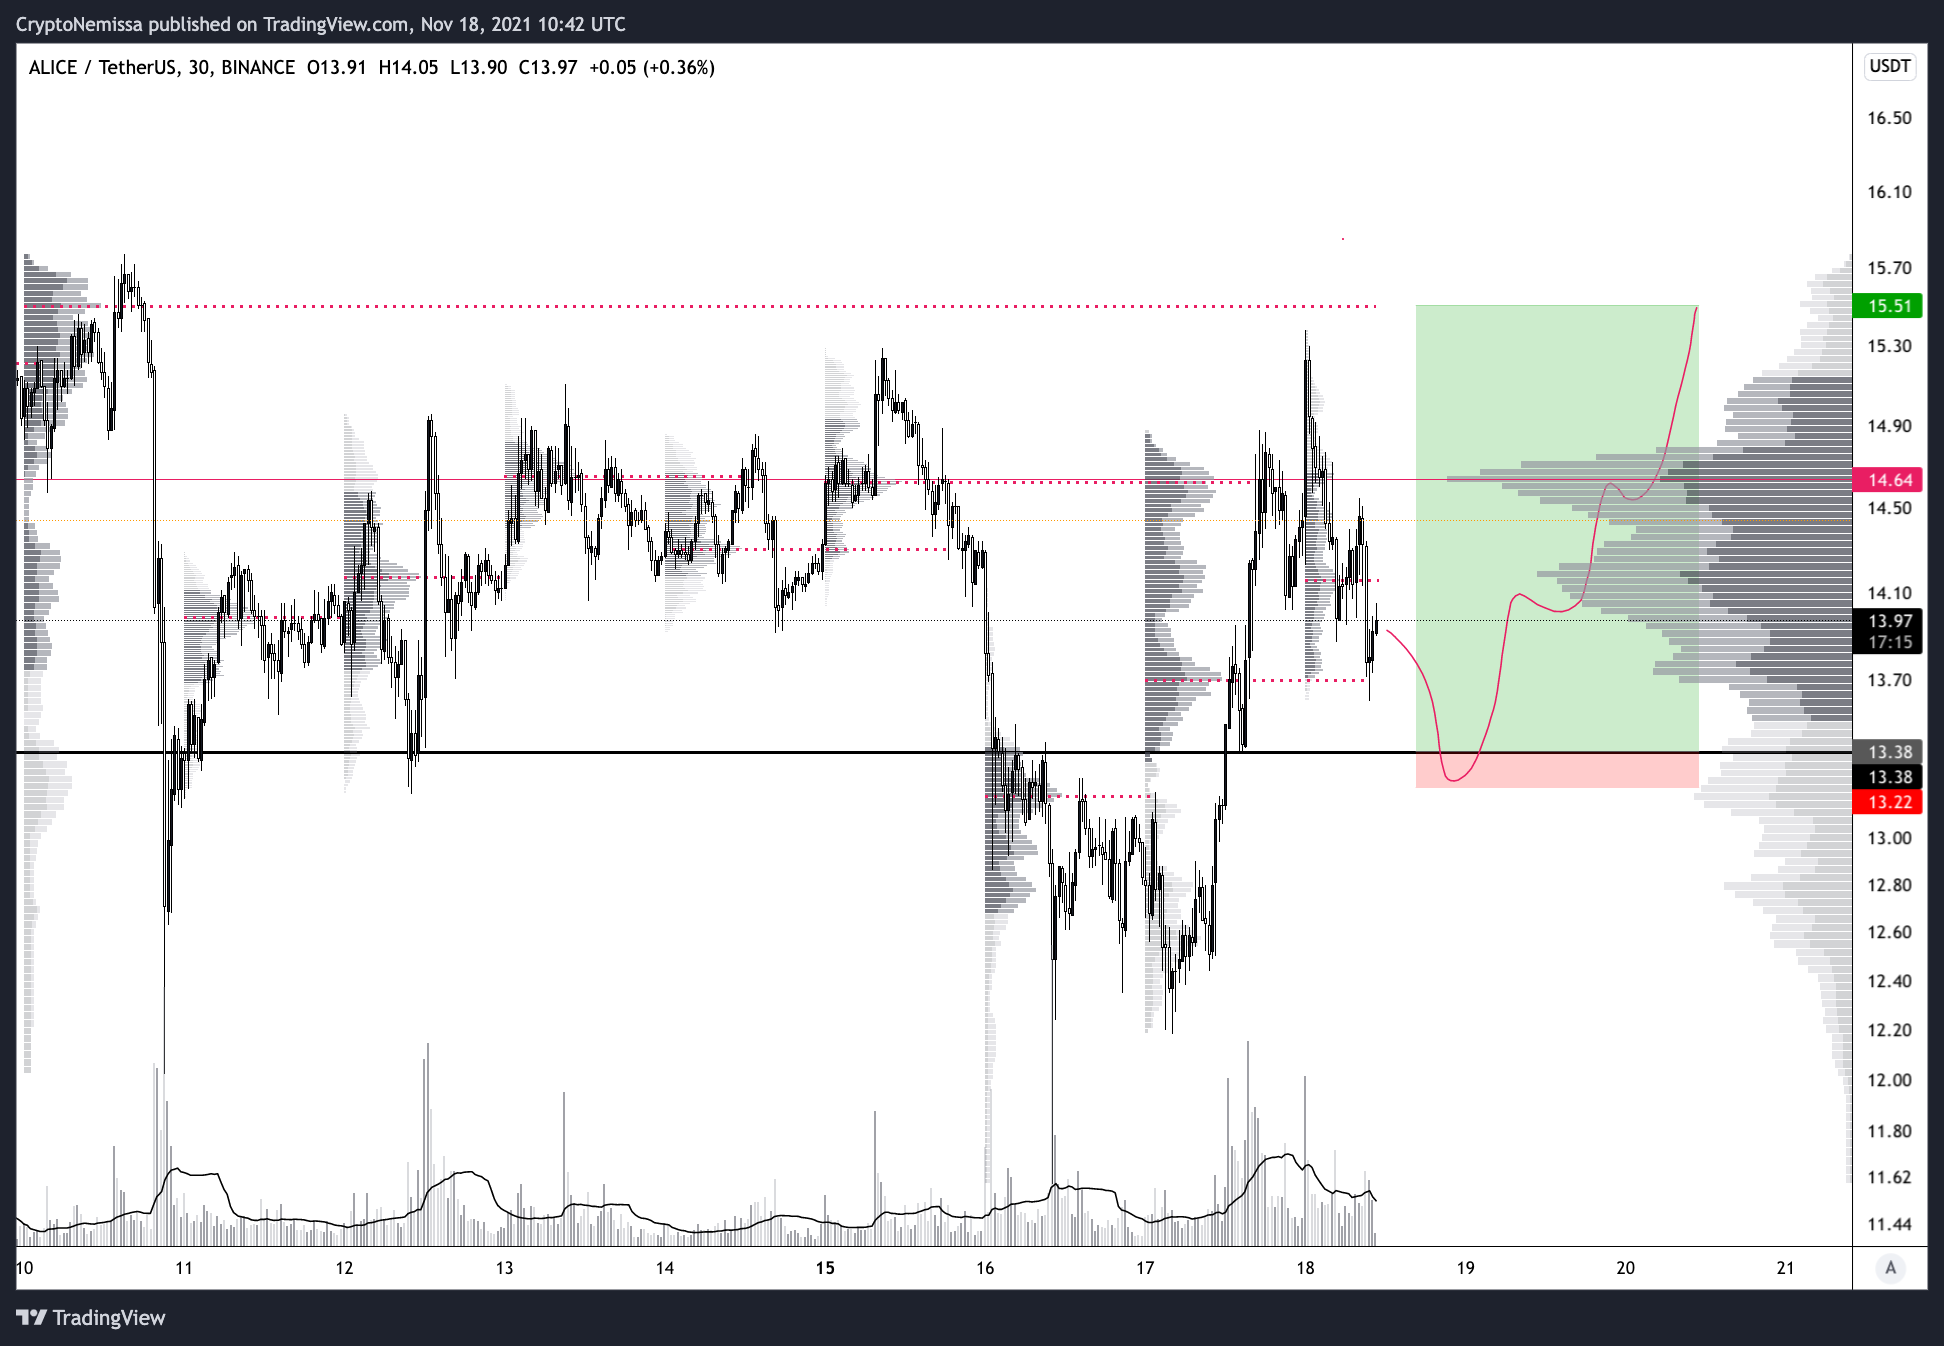
Figure 7. Example of a potential trade plan based on the VPSV
Obviously this has to be a reactive approach rather than placing limit orders at these levels. If you trade alts, it’s always a good edge to watch BTC’s order flow on another screen to see if there is big amount of trapped sellers or buyers at the levels you’re willing to long / short.
VI. Volume Profile: Fixed Range
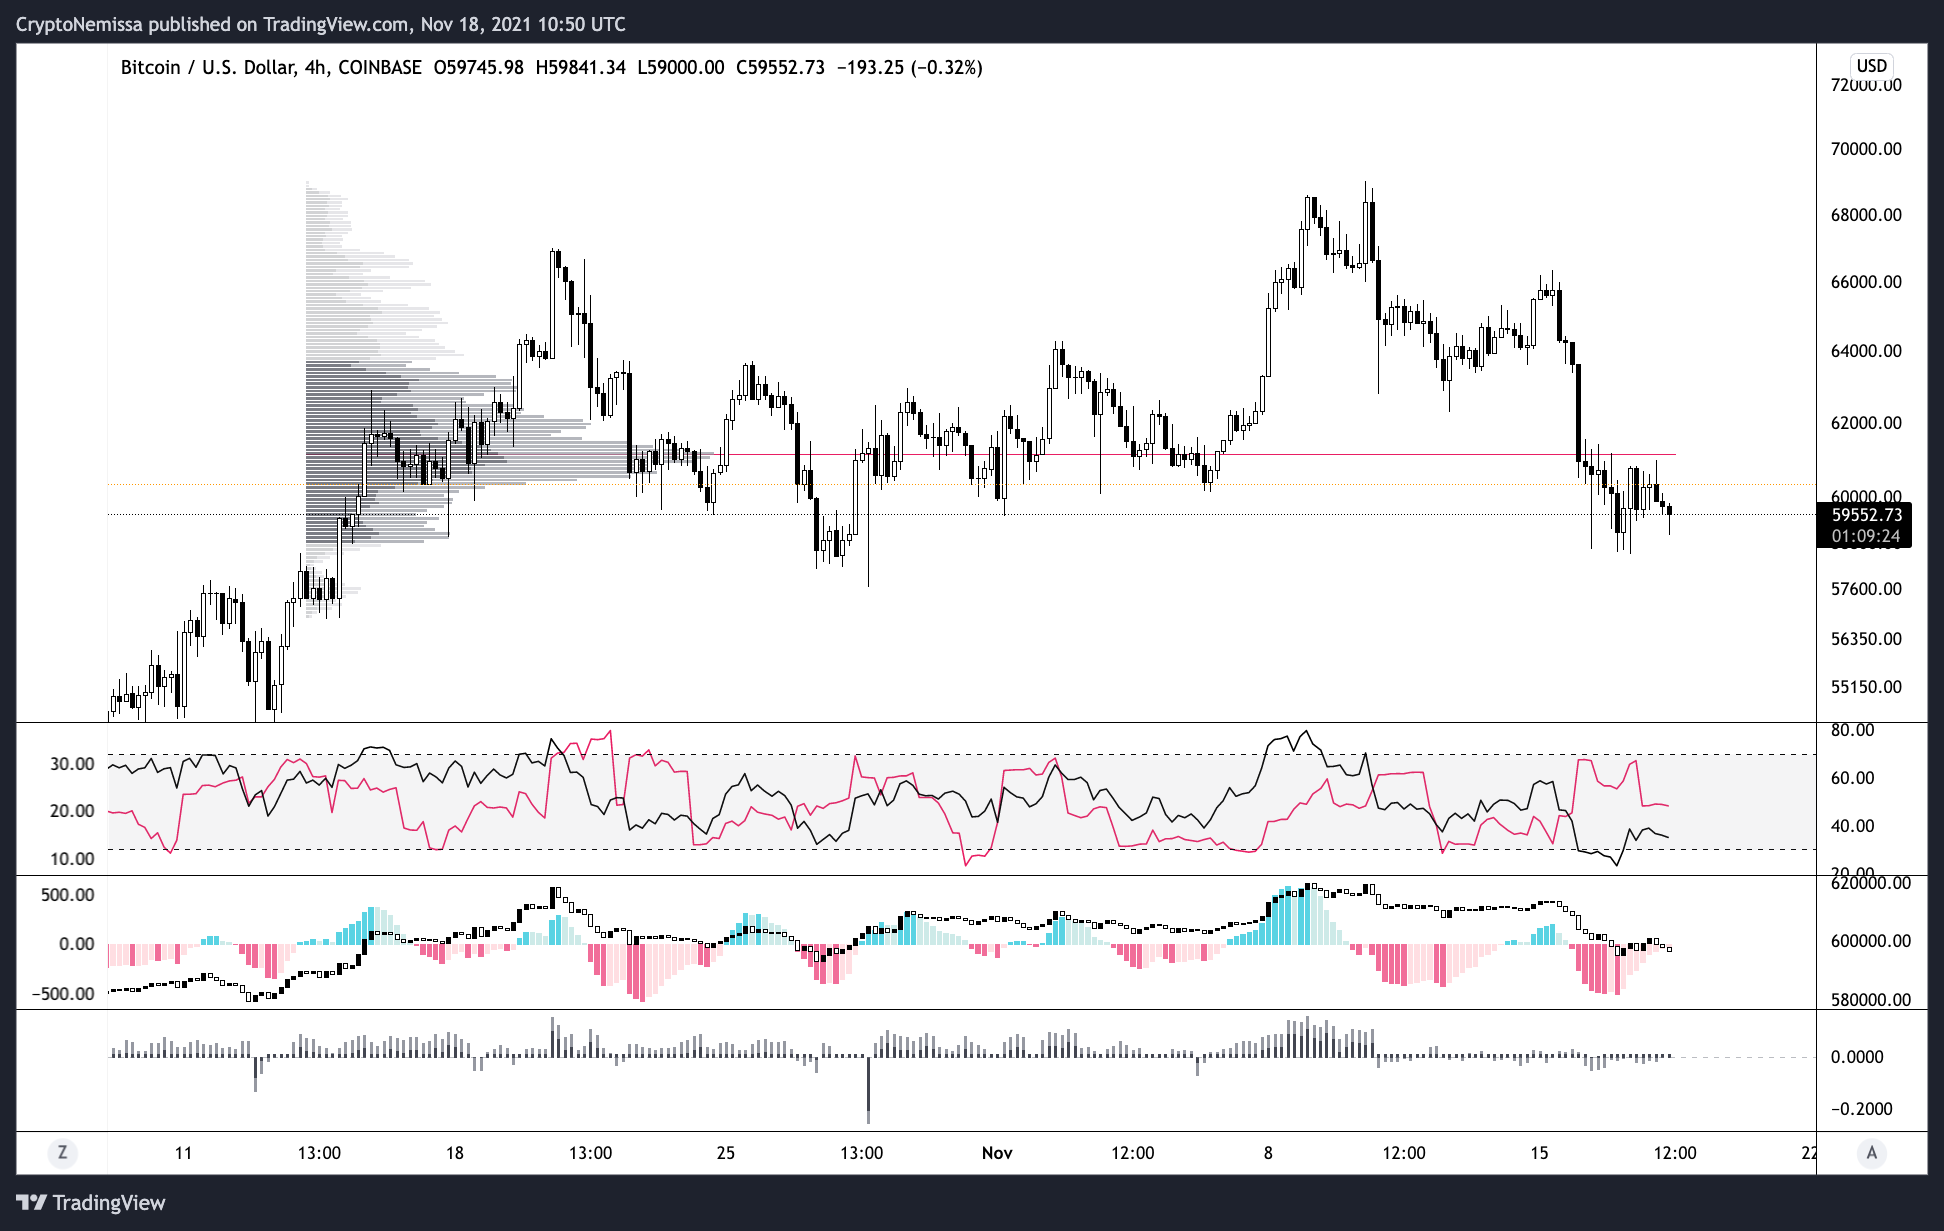
Figure 8. A fixed range plotted on BTC/USD
Most charting platforms have the possibility to let you select a fixed range to create your own volume profile (“Fixed Range” on Trading View). It’s definitely effective for segmenting certain parts of the price action and have its composite profile. In a range it can be used, in confluence with S/R levels, to enter & exit trades at HVNs/LVNs edges or VAL/VAH. Nonetheless, one the most interesting use is backtesting. Because the VPVR will include recent price action in its composite, it is sometimes complicated to evaluate whether reactions were genuinely based on a key Volume Profile level or if the reaction itself created the key level…Therefore, you can make use of a fixed range and exclude the most recent PA to see if your analysis was correct or not.
VII. The Most Important Concept about the Market
We will finish this article with the most important observation one can have about the market. A market essentially wants to be efficient, i.e. facilitate trades between buyers and sellers at high volume during a prolonged period of time. However, in many cases markets are inefficient and jump from level to level at low volume and short period of time. This is why you see pullbacks & rallies back into illiquid areas to distribute more volume and more time, so the market becomes efficient at these levels.

Figure 9. Fixed range plotted on BTC/USD from early 2021 to 21st July 2021
To illustrate this concept on a HTF perspective, a Fixed Range Volume Profile is plotted on BTC from early 2021 to 21st July 2021, and key levels such as low volume ones and a LVN are marked. You can notice that there is always a rejection of low volume point (horizontal levels) and that after the second rejection, the market will get into the LVN to distribute more time and volume. Below that LVN, you can also see a massive composite HVN that prevented BTC to get back to the 29k level, as it would imply going all the way through it. Being essentially a massive pool of swimming liquidity, where volume and time has already been well distributed, there is no point for the market to go back there right away as it’s an efficient zone already.

Figure 10. Low liquidity areas compensated with time & volume
To further demonstrate this concept on a lower timeframe, you can notice an inefficient move up between $62,570 to 65,113 (significant jump in price done very fast on low volume) that leaves an illiquid area. The market will then revisit the area to distribute more time & volume. On the same chart, you can see smaller similar moves that leads to the same behaviour from the market.
Be careful though, an inefficient move up doesn’t mean that the market has to come back fill this time & volume gap right away. More often than not, trending markets will leave tons of inefficient areas that may or may not be revisited at a later date. That’s why you’ll see most major moves having 3 or more impulses until some of them get revisited on a retracement. However, in ranging markets, gaps tend to be filled very quickly like on the example above.
VIII. Conclusion
Trading with the Volume Profile can offer very interesting perspectives on the market because it’s an indicator that isn’t derived from the price, unlike the RSI or EMAs. Volume, which is on the three components defining an auction with time and price, allows to spot areas where the market is efficient and where it’s illiquid. Marking key Volume Profile levels, such as VAH, VAL and POC in confluence with supports & resistances can help you formulate a trade plan, especially regarding your entries and exits. Nevertheless, it is important to wait for a reaction out of one of these levels to enter, especially on crypto markets that are less liquid and more volatile, providing less precision than legacy markets.
References
It is now time to credit better traders that I’ve been following along the years and from whom I learned several concepts highlighted in this article.
@abetrade: Adam’s blog Trading Riot is an excellent source for everything related to order flow trading (Footprint Charts, Market Profile, etc.).
@Trader_xB: xB has a Discord server with some very interesting educational materials explaining the concept of inefficiencies’ rebalancing.
ParaCurve Trading has great articles and YouTube videos regarding Volume Profile trading and order flow.